A Figure
Related to Figures in
Probability and Statistical Inference, seventh edition
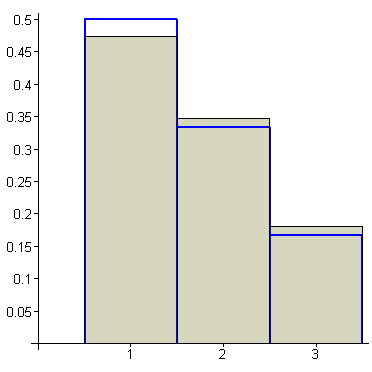
Figure 1.1-2: Relative frequency histogram (wheat)
and probability histogram (blue)
Return to Directory